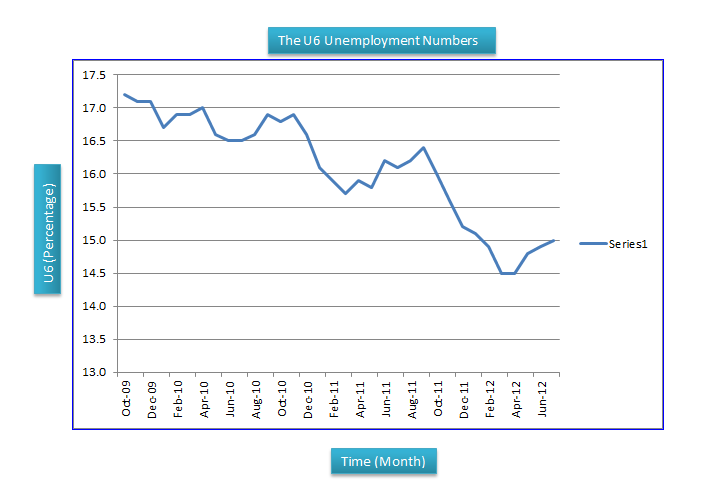
 The graph posted above was compiled from data listed on Portal Seven. It begins at the peak unemployment number reported in October 2009. It shows the downward trend happening after the end of the recession.
There are a few points of interest. The first point of interest is the swearing in of the new republican house members. Notice the unemployment numbers started and increase through to the point of the budget deal. The numbers then start to go down again until election season started heavy in the spring of this year.
Are these numbers a coincidence or is something else happening?
The republicans argue uncertainty is caused by the Obama administration policies. Maybe the response is this graph. The inflection points show republicans disrupting economic growth.

